Perl performance on Apple M1
I recently got an Apple M1 Mac Mini, half out of curiosity, half because it was exactly what I would need: I have a low end Mac just to try out things like new Xcode betas etc, like a "canary" machine. My old 2012 Mac Mini stopped getting official Apple updates, so it could no longer do what I needed and the 8GB RAM, 256GB SSD M1 mini at $699 is easily the cheapest Mac you can buy.
Overall, unlike the typical Mac Minis of old which seemed to be on the slow side, it did feel quite fast from the start, so I thought I'd run some benchmarks on it for fun to see how Apple's ARM M1 fares against some x86 competition. And, as in my day job I use mostly Perl, I thought some perl-related benchmarks would be of interest to me.
For those not aware, the M1 is an ARM-based CPU (well, includes GPU, so SoC really), with 8 cores total (4x performance @ 3.2GHz/12MB L3, 4x efficiency @ 2GHz/4MB L3) built at 5nm and consuming up to 15W. Basically the "laptop" class CPU of what Apple has been building for iPhones/iPads. Apart from native ARM code, it can run x86 code through Rosetta 2, but I still can't use it for work - our dev environment currently relies on VirtualBox which needs actual x86/VT-x silicon. I ran benchmarks against my work laptop, a Mid 2015 15" MacBook Pro with a 2.5GHz i7 Crystalwell. Even though it was Apple's top of the line at the time, it's a bit old now, I keep it for the non-butterfly keyboard and the full complement of ports, and until recently the newer Macs weren't much faster anyway. Although an older i7 will make it easier for the M1 to compete, I still find the comparison quite interesting, especially since the Mac Mini has always been the "slow/cheap" Mac - and it's now even cheaper. Plus I'll throw some tests with different hardware just for comparison.
The Benchmarks
I will definitely not claim the benchmarks I ran are truly representative of real world performance, especially when I am of the opinion you should benchmark your own code - what you personally would run. But, I also added some typical things most perl users might do and some things that came up when looking for Perl "benchmarks", so that anybody can try them and get an idea of the relative performance of their own machine.- Building perl 5.32.1
perlbrew install perl-5.32.1
- Moose 2.2015
cpan MooseThen, I can try the test suite after preloading Moose with yath at 1, 4, 6 threads. In the last case, the M1 will have to use its efficiency cores, while the i7 will use HT:
yath -PMoose
yath -PMoose -j4
yath -PMoose -j6
- prime.pl
use strict;
use warnings;

use Time::HiRes 'time';
my $time = time();

my $n = $ARGV[0] || 100000000;
my @s = ();
for (my $i = 3; $i < $n + 1; $i += 2) {
    push(@s, $i);
}
my $mroot = $n**0.5;
my $half  = scalar @s;
my $i     = 0;
my $m     = 3;
while ($m <= $mroot) {
    if ($s[$i]) {
        for (my $j = int(($m * $m - 3) / 2); $j < $half; $j += $m) {
            $s[$j] = 0;
        }
    }
    $i++;
    $m = 2 * $i + 3;
}

my @res = (2, grep($_, @s));
warn "Found ".scalar(@res)." primes in ".(time()-$time)." sec.\n";
- phoronix-test-suite-10.2.2
phoronix-test-suite run pts/perl-benchmark
- BioPerl
use strict;
use Bio::SeqIO;
use Bio::Tools::SeqStats;
use Benchmark qw(:all);

my $in = Bio::SeqIO->new(-file => "gbbct10.seq", -format => "genbank");

timethis(1, sub {
    my $seq = $in->next_seq;
    my $seq_stats = Bio::Tools::SeqStats->new($seq);
    my $codon_ref = $seq_stats->count_codons();
});

timethis(1, sub {
    my $builder = $in->sequence_builder();
    $builder->want_none();
    $builder->add_wanted_slot('display_id','seq');
    for (1..10000) {
        my $seq = $in->next_seq;
        my $seq_stats = Bio::Tools::SeqStats->new($seq);
        my $weight = $seq_stats->get_mol_wt();
        my $monomer_ref = $seq_stats->count_monomers();
    }
});
- Precession
use Astro::Coord::Precession 'precess';

my $precessed = precess([rand(24), rand(180)-90], rand(200)+1900, rand(200)+1900)
    for (1..1000000);
- Text processing
The Good (aka: The Results)
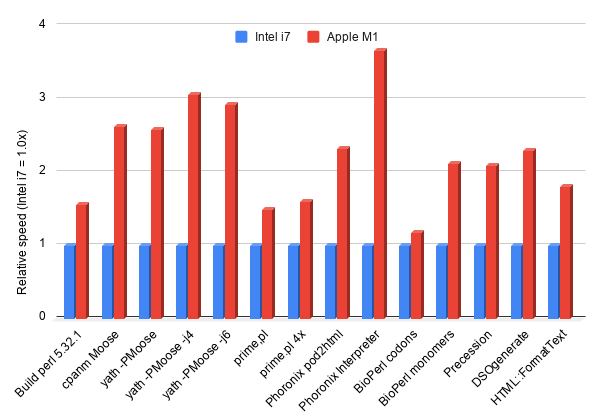
Or, if we want a nice comparison graph where the i7 is "1x" speed and plot the M1 in relation to it:

The Bad
test % perl prime.pl
Found 1270607 prime numbers in 2.7765851020813 sec.
test % perl prime.pl
Found 1270607 prime numbers in 2.78401112556458 sec.
test % perl prime.pl
Found 1270607 prime numbers in 2.77585196495056 sec.
test % sh batch.prime.sh
test % Found 1270607 prime numbers in 3.00496196746826 sec.
Found 1270607 prime numbers in 3.01989006996155 sec.
Found 1270607 prime numbers in 3.02487397193909 sec.
Found 1270607 prime numbers in 3.02904796600342 sec.
test % sh batch.prime.sh
test % Found 1270607 prime numbers in 3.01903891563416 sec.
Found 1270607 prime numbers in 3.02826595306396 sec.
Found 1270607 prime numbers in 3.02855086326599 sec.
Found 1270607 prime numbers in 3.03278708457947 sec.
test % perl prime.pl
Found 1270607 prime numbers in 4.18084216117859 sec.
test % perl prime.pl
Found 1270607 prime numbers in 3.94040703773499 sec.
test % perl prime.pl
Found 1270607 prime numbers in 5.06315612792969 sec.
test % perl prime.pl
Found 1270607 prime numbers in 5.53617215156555 sec.
test % perl prime.pl
Found 1270607 prime numbers in 5.34210705757141 sec.
test % sh batch.prime.sh
test % Found 1270607 prime numbers in 3.04679107666016 sec.
Found 1270607 prime numbers in 3.07015514373779 sec.
Found 1270607 prime numbers in 3.07026290893555 sec.
Found 1270607 prime numbers in 3.07335591316223 sec.
test % sudo nice -20 perl prime.pl
Found 1270607 prime numbers in 5.50178408622742 sec.
test % perl prime.pl
Found 1270607 prime numbers in 5.03745698928833 sec.
test % sh batch.prime.sh
test % Found 1270607 prime numbers in 3.04621696472168 sec.
Found 1270607 prime numbers in 3.0637059211731 sec.
Found 1270607 prime numbers in 3.07231998443604 sec.
Found 1270607 prime numbers in 3.07551097869873 sec.
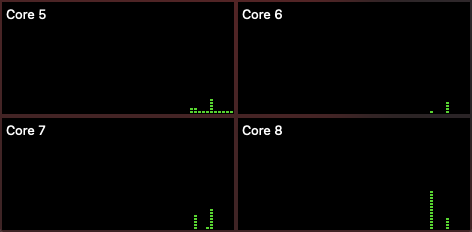
powermetrics -s cpu_powerThe result is not interesting enough to post, because both when the system is in the "good" and the "bad" state, only the performance cores are used (but not just one of them as I expected - a random mix, different each time, but similarly random for both "states"). It's the same story using the CPU history window:

test % perl prime.pl
Found 1270607 prime numbers in 2.77031397819519 sec.
test % /usr/bin/perl prime.pl
Found 1270607 prime numbers in 2.95687794685364 sec.
test % perl prime.pl
Found 1270607 prime numbers in 2.77954316139221 sec.
test % /usr/bin/perl prime.pl
Found 1270607 prime numbers in 2.95602297782898 sec.
test % perl prime.pl
Found 1270607 prime numbers in 2.77461099624634 sec.
test % /usr/bin/perl prime.pl
Found 1270607 prime numbers in 2.94599509239197 sec.
test % perl prime.pl
Found 1270607 prime numbers in 5.44245409965515 sec.
test % /usr/bin/perl prime.pl
Found 1270607 prime numbers in 4.92102980613708 sec.
test % perl prime.pl
Found 1270607 prime numbers in 5.34624910354614 sec.
test % /usr/bin/perl prime.pl
Found 1270607 prime numbers in 3.51168012619019 sec.
test % perl prime.pl
Found 1270607 prime numbers in 5.66441202163696 sec.
test % /usr/bin/perl prime.pl
Found 1270607 prime numbers in 3.62216806411743 sec.
test % perl prime.pl
Found 1270607 prime numbers in 5.46292304992676 sec.
 Computer scientist, physicist, amateur astronomer.
Could you wrap these up in to a github (etc) repo that others could use to duplicate the benchmarks?
sounds like the "bad state" is preferring the efficiency cores instead of the performance cores.
Apart from the last two that are proprietary, all the others have the full code here (if they are programs, otherwise the exact command I run with
time). Not sure what more a github repo would do? Is there something specific you can't reproduce?I wrote about it above, it was my first idea, which is why I ran powermetrics to make sure, and indeed it is still using the performance cores, same profile as before the sleep/wake cycle, so no idea what happens.
What I mean is to wrap up what you can in a script so its quick and easy for someone to replicate. Spitting out a result that can be compared to other results.
A bit late, but you might enjoy my DKBench, which is similar to what I did above, in a single test-suite, made for subsequent perl benchmarking which will probably end up in another blog post.