Visualizing Dependencies On Stratopan
I've always found it difficult to comprehend the relationships between all the Perl modules in a large application. So for a long time I used GraphViz to create dependency graphs. But I was never quite happy with them because they were fairly static and hard to understand once you had more than a couple dozen modules in play.
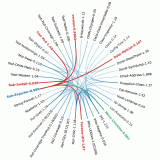
Then a few weeks ago, I discovered D3. The sample gallery has a very nice interactive dependency graph. Since it is organized in a circle, it scales to a large number of modules very well. So now, every repository on Stratopan will have graphs like this one (click the picture at left to view the interactive demonstration).
The graph isn't as intuitive as I would like yet, so let me explain a bit... What you're seeing are the relationships between all the distributions on a "stack" in a Stratopan repository. In this case, the stack contains everything required to build, test, and run Perl::Critic. When you hover over a distribution name, the relationships are highlighted. Dependencies (i.e things it requires) are connected with red lines, and Dependers (i.e. things that require it) are connected with green lines.
Over time, I hope to add more helpful visualizations like this to Stratopan. If you've got some ideas, I'd love to hear them.
 Hacker, speaker, author, dad.
I wonder if having arrows in appropriate direction when all links are either dependencies or requirements would make it easier to visualize...
I think it looks great.
Can you animate the initial load of the library to spiral out from a small dot to full size? Just an idea.
Visually this is very slick and compact compared to other methods (e.g., directed acylic graph).
This is really cool!