Perl Weekly Challenge 165: Line of Best Fit
These are some answers to the Week 165 of the Perl Weekly Challenge organized by Mohammad S. Anwar.
Spoiler Alert: This weekly challenge deadline is due in a few of days from now (on May 22, 2022 at 24:00). This blog post offers some (partial) solutions to this challenge, please don’t read on if you intend to complete the challenge on your own.
This week, Task 1 and part of Task 2 relate to Scalable Vector Graphics (SVG). I’ve been using SVG a very long time ago and certainly don’t remember any of the details. SVG is certainly not very difficult, and I would be delighted to refresh my memory on this subject, but it takes quite a bit of time to assimilate all the possibilities and options, and I don’t have time for that now. So, I will only cover for the moment the part of the challenge not related to SVG. In the (relatively unlikely) event that I find some time over the weekend, I might come back and fulfill the SVG part.
Update: I eventually covered the SVG part in Raku here.
So, Task 2 is about line of best fit or linear regression.
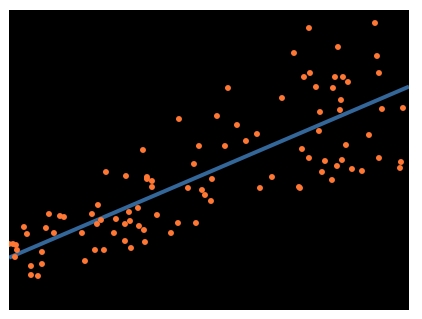
When you have a scatter plot of points, a line of best fit is the line that best describes the relationship between the points, and is very useful in statistics. Otherwise known as linear regression, here is an example of what such a line might look like:
The method most often used is known as the least squares method, as it is straightforward and efficient, but you may use any method that generates the correct result.
Calculate the line of best fit for the following 48 points:
333,129  39,189 140,156 292,134 393,52  160,166 362,122  13,193
341,104 320,113 109,177 203,152 343,100 225,110  23,186 282,102
284,98  205,133 297,114 292,126 339,112 327,79  253,136  61,169
128,176 346,72  316,103 124,162  65,181 159,137 212,116 337,86
215,136 153,137 390,104 100,180  76,188  77,181  69,195  92,186
275,96  250,147  34,174 213,134 186,129 189,154 361,82  363,89
If we consider a cloud of n points with coordinates (x, y), the line of best fit is defined as follows:
The equation for the slope m is:
    n * sum(xy) - sum(x) * sum(y)
m = -----------------------------
    n * sum(x²) - sum(x) * sum(x)
The y-intercept (i.e. value of y on the vertical axis, when x = 0) b is:
    sum(y) - m * sum(x)
b = -------------------
           n
The equation of the line is:
y = mx + b
Line of Best Fit in Raku
The following program is just an application of the explanations above. We split the input string on spaces and on commas, to get an array of (x, y) values. The lsm subroutine applies the above least square method formulas to find the slope and intercept. Note that for displaying line of best fit equation, we had to handle two different cases, depending on whether the intercept is positive or negative. Otherwise, for a negative intercept, we would display the line equation as follows:
The equation of the line of best fit is: y = 1.00 x + -1.00
which is not satisfactory.
Also note the use of the » hyper operator when reading the input data to apply the second split to each of the values returned by the first split.
my $input =
   '333,129  39,189 140,156 292,134 393,52  160,166 362,122  13,193
    341,104 320,113 109,177 203,152 343,100 225,110  23,186 282,102
    284,98  205,133 297,114 292,126 339,112 327,79  253,136  61,169
    128,176 346,72  316,103 124,162  65,181 159,137 212,116 337,86
    215,136 153,137 390,104 100,180  76,188  77,181  69,195  92,186
    275,96  250,147  34,174 213,134 186,129 189,154 361,82  363,89';

# $input = '1,0 2,1 3,2 4,3'; # test with a negative intercept

my @points = $input.split(/\s+/)».split(/','/);
my ($slope, $intercept) = lsm(@points);
say "Slope: $slope, intercept = $intercept";
my $sign = $intercept < 0 ?? '-' !! '+';
printf "The equation of the line of best fit is: y = %.2f x %s %.2f \n", $slope, $sign, $intercept.abs;

sub lsm (@points) {
    my ($s-x, $s-y, $s-xy, $s-x2) = 0 xx 4;
    for @points -> $point {
        my ($x, $y) = $point[0, 1];
        $s-x += $x;
        $s-y += $y;
        $s-xy += $x * $y;
        $s-x2 += $x ** 2;
    }
    my $n = @points.elems;
    my $slope = ($n * $s-xy - $s-x * $s-y) / ($n * $s-x2 - $s-x ** 2);
    my $intercept = ($s-y - $slope * $s-x) / $n;
    return $slope, $intercept;
}
This program displays the following output:
$ raku ./lsm.raku
10366, 6497, 1220463, 2847440
Slope: -0.2999565, intercept = 200.132272536
The equation of the line of best fit is: y = -0.30 x + 200.13
Uncomment the line redefining the input string to display the result with a negative intercept:
$ raku ./lsm.raku
Slope: 1, intercept = -1
The equation of the line of best fit is: y = 1.00 x - 1.00
Line of Best Fit in Perl
We are applying here the same equations as before in Raku. For the final display of the line equation, we also have to handle separate cases, depending on whether the intercept is positive or negative. Perl doesn’t have the » hyper-operator, but it is quite easy to replace it with a map.
use strict;
use warnings;
use feature "say";

my $input =
   '333,129  39,189 140,156 292,134 393,52  160,166 362,122  13,193
    341,104 320,113 109,177 203,152 343,100 225,110  23,186 282,102
    284,98  205,133 297,114 292,126 339,112 327,79  253,136  61,169
    128,176 346,72  316,103 124,162  65,181 159,137 212,116 337,86
    215,136 153,137 390,104 100,180  76,188  77,181  69,195  92,186
    275,96  250,147  34,174 213,134 186,129 189,154 361,82  363,89';

# $input = '1,0 2,1 3,2 4,3';   # test with a negative intercept

my @points = map { [split /,/, $_] } split /\s+/, $input;
my ($sl, $inter) = lsm(@points);
say "Slope: $sl, intercept = $inter";
my $sign = $inter < 0 ? '-' : '+';
printf "The equation of the line of best fit is: y = %.2f x %s %.2f \n", $sl, $sign, abs $inter;

sub lsm {
    my @points = @_;
    my ($s_x, $s_y, $s_xy, $s_x2) = (0, 0, 0, 0);
    for my $point (@points) {
        my ($x, $y) = ($point->[0], $point->[1]);
        $s_x += $x;
        $s_y += $y;
        $s_xy += $x * $y;
        $s_x2 += $x ** 2;
    }
    my $n = scalar @points;
    my $slope = ($n * $s_xy - $s_x * $s_y) / ($n * $s_x2 - $s_x ** 2);
    my $intercept = ($s_y - $slope * $s_x) / $n;
    return $slope, $intercept;
}
This program displays the following output:
$ perl ./lsm.pl
Slope: -0.299956500261231, intercept = 200.132272535582
The equation of the line of best fit is: y = -0.30 x + 200.13
Uncomment the line redefining the input string to display the result with a negative intercept:
$ perl ./lsm.pl
Slope: 1, intercept = -1
The equation of the line of best fit is: y = 1.00 x - 1.00
Wrapping up
The next week Perl Weekly Challenge will start soon. If you want to participate in this challenge, please check https://perlweeklychallenge.org/ and make sure you answer the challenge before 23:59 BST (British summer time) on May 29, 2022. And, please, also spread the word about the Perl Weekly Challenge if you can.
 I am the author of the "Think Perl 6" book (O'Reilly, 2017) and I blog about the Perl 5 and Raku programming languages.
Leave a comment