Devel::Trepan Debugger command aliases and command completion
In my first blog I described why I wrote a new debugger for Perl and how the rewrite helps me add cool features more easily. Here I'll start to describe the cool features of this debugger. To my knowledge, all of the features described below are not in perl5db.
As mentioned in the last blog, this debugger follows gdb conventions. One implication then is that commands follow the gdb names and thus are no longer limited to one (or two) characters. But you may think well won't it be cumbersome typing in those extra characters? No, and for several reasons. First, the debugger has command aliases, which is a way to give a debugger command name an alias. And many of the aliases given by default are single letters. For example T is an alias for the gdb command backtrace. Of course, you are free to change or remove aliases. To see a list of aliases in effect type alias
(trepanpl): alias
List of alias names currently defined:
  $    T     cond      eval%     fin      n        p        s      u
  %    a     cont      eval%?    kill!    n+       q        s+     where
  ?    b     disasm    eval?     l        n-       q!       s-
  @    bt    e         eval@     l>       next+    quit!    step+
  R    c     eval$     eval@?    list>    next-    re.pl    step-
Notice how the list is nicely aligned in columns courtesy of the Array::Columnize module.
In addition to aliases, the debugger has command completion. So if you type "ba" and the tab key, the command name will fill out to "backtrace". If there is more than one completion for the prefix given then all of valid completions are listed. So for example of you just type b and the tab key you will see "backtrace" and "break". But entering "b" by itself will run the "break" command because "b" is an alias as seen in the above list. Command completion is very context sensitive. So entering set and completing that you get "set " with a space appended; then completing that you get:
(trepanpl): set
abbrev       basename     different    highlight    return      trace
auto         confirm      evaldisplay  max          timer       variable
And you can complete on each of those suboptions as well. Here's an example of a something context-sensitive and run-time sensitive. Suppose you enter b 1 and then hit tab. You will get a list of all the valid breakpoint line numbers that begin with "1". (For example it is 10, 12 and 18 if you debug the trepan.pl program itself.
Another aspect of this debugger which you find in gdb but not so much in perl5db is its extensive on-line help. Following gdb there is help by category or by individual command. And you can enter a Perl regular expression and you will be given a list of commands that match that regular expression. Since, the debugger is written in Perl, adding a feature like this is pretty easy to do.
Possibly the first thing though that you may notice about this debugger is that by default it shows the Perl code marked up in color. Here is a screen shot of that.
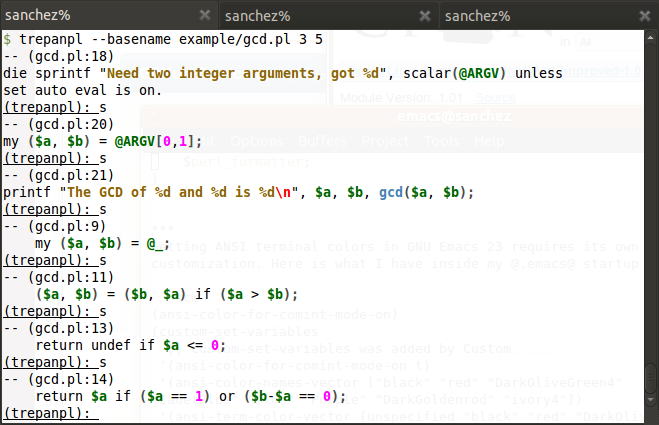
That's it for now. In the next blog I'll discuss how some of the cool aspects of the eval command. See github Devel::Trepan wiki for more stuff or better yet, just go into the debugger and ask use the help command.
 I blog about Perl.
Leave a comment