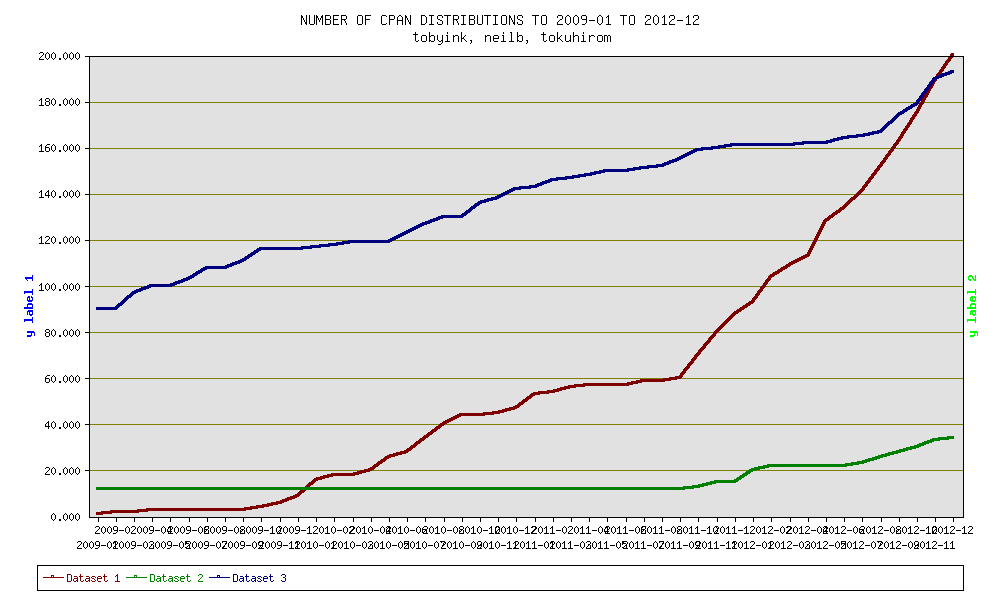
Graphing CPAN author's number of distributions over time
Script: graph-cpan-dists-over-time
One glaring deficiency: does not take PAUSE deletions into account (is there a MetaCPAN API for this?) Thus, the number of actual dists on the graph is monotonically increasing and might be higher than the number of actual dists on CPAN.
Generated graph is still rough and number of authors is limited at three because I'm too lazy to tweak the sample script from Chart::Lines.
Sample graph:
 .
.
Enjoy and feel free to improve on it.
Leave a comment