Visualizing YAPC::Asia with HRForecast
This year we're using HRForecast to keep track of ticket sales and talk submissions for YAPC::Asia Tokyo 2013, and it's looking good. I highly recommend you using these tools to visualize your data
My colleague @kazeburo is an extremely talented operations engineer. One of the things he stands by (note: I don't I think I ever heard him say these words to my face, but I believe from his actions and his products that this is what he thinks is important) is that to really grok what's going on in your system, you need to visualize your data.
So he wrote his "x-forecast" family of products, "CloudForecast", "GrowthForecast", and "HRForecast". (They are all perl products, FYI)
CloudForecast visualizes server stats (in your "cloud", hence the name), such as CPU usage, Memory usage, disk usage, etc. It's basically munin, w/ stuff to scratch his itch.
GrowthForecast is sort of a generalization of CloudForecast -- it doesn't define what metrics it's recording but instead allows you to visualize any real-time data such as: number of HTTP requests per second, number of items in a queue at the moment, etc. Because this graph can be generated via HTTP API calls, all you need to do is to setup GrowthForecast, and a cron job or something that periodically makes HTTP POST request, and you get a nice looking graph.
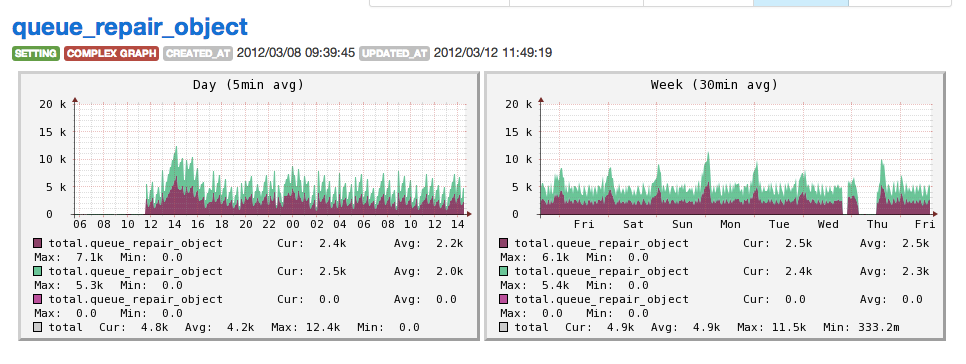
Below is a sample of GrowthForecast graph, which shows the number of items in an STF queue (which is an Amazon S3-like distributed storage). This is generated by simply doing a "SELECT COUNT(*)..." and then calling LWP to POST to GrowthForecast. Easy, and yet extremely effective.
HRForecast is much like GrowthForecast in that you can create graphs by issuing HTTP requests, but the difference is that HRForecast is not restricted to real-time data so you can post a piece of data to graph AND time which this happened. It also aims to visualize data for a much longer span, typically weeks and years.
So that was a long setup, but here's where YAPC::Asia Tokyo 2013 comes in. Until last year we basically just manually checked our databases or looked up the web page for the company doing the ticket sales to get the number of registered talks and/or number of tickets sold, but this year I wanted to slack off more: I wanted to just look at a graph every morning, and know what our status was.
So we setup HRForecast!
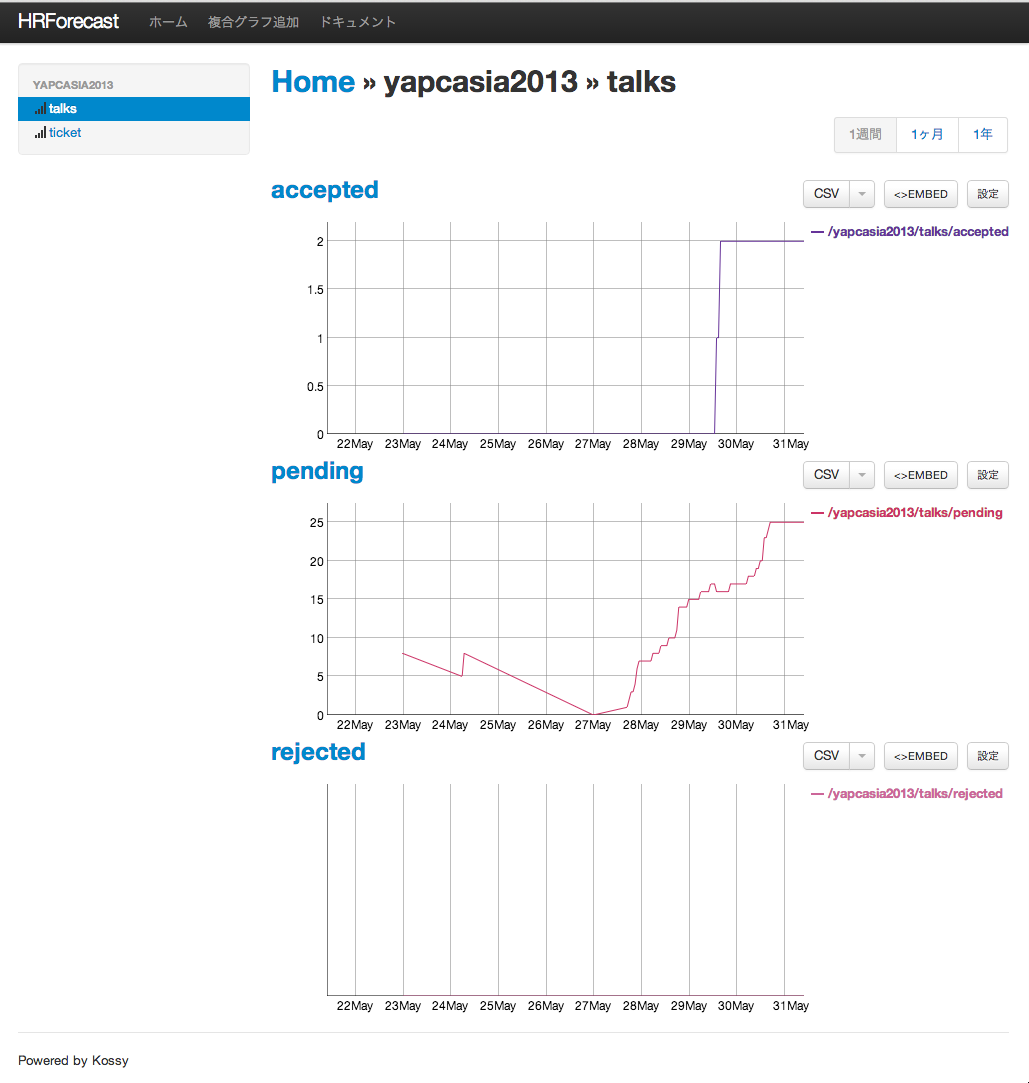
Then I made a few cron jobs that counts the number of registered talks via "SELECT COUNT(*) ...", and another batch that fetches CSV files from the ticketing service, groups them by their ticket types, and counts the number of tickets. All of these then just makes HTTP requests to HRForecast, and we're done.
The result looks like below. Now all I do is to check these graphs every morning, and I can immediately see the status of our conference. Neato!
 Japan Perl Association director; LINE, Inc; Tokyo, Japan
Leave a comment