April 2013 Archives

Using kcachegrind on potion

cachegrind gives you information on the callstack and callcount, dependencies and efficiency. You can easily see hotspots in your code.

I use it to check the JIT and objmodel efficiency of potion, which is the vm for p2.

See my first post today Install kcachegrind on MACOSX with ports if you are on a Mac.

cachegrind

The first run with:

$ make bin/potion-s
$ valgrind --tool=callgrind -v --dump-every-bb=10000000 bin/potion-s example/binarytrees.pn
Ctrl-C

generates this sample

 $ open qcachegrind

Open one of the generated callgrind.out.pid.num files.

qcachegrind.jpg

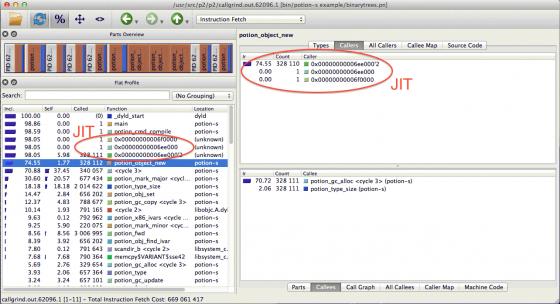
This code creates a lot of objects (potion_object_new), potion_object_new is called by the JIT (not instrumented because we did not use --dump-instr=yes (Click on machine code on the right lower pane), and potion_object_new spends most of its time allocating memory in the GC (potion_gc_alloc). 20-30% of the code is spent in the GC (potion_gc_mark_major and the other gc calls).

Instruments

Compare that to the Apple XCode tool Instruments:

$ open /Applications/Xcode.app/Contents/Applications/Instruments.app
  • Select the Instrument "Time Profile"
  • Select the target "bin/potion-s"
  • Adjust the target settings with "Edit Active Target"

I used args "-B example/binarytrees-list.pn" for the bytecode vm, not the default jit. and I need to set the working directory, because the example is under the root.

Instruments.jpg

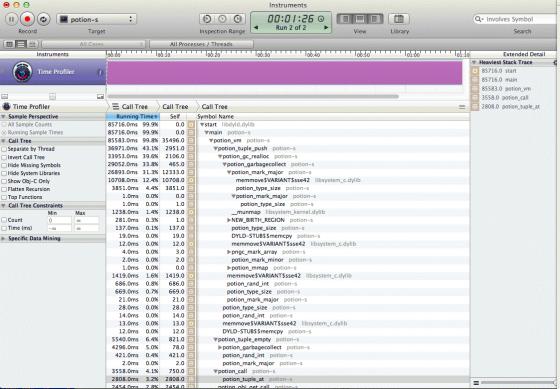
This is a different sample, without JIT, and with using arrays (tuples) instead of objects. This way you can see any possible object overhead. And we see that most of the time tuple_push (add an array value) is not spent doing alloc, but realloc, an area where the GC should shine. But realloc apparently causes a lot of GCs. Of 39% realloc 30% is causing a full mark & sweep phase (mark_major), not a small mark_minor phase. But we are dealing with fresh objects here, not hot objects.

cachegrind graphviz

With the graphviz extension you can see the call graph easier. See the "Call Graph" tab on the lower right pane, which creates this graph.

obj_new_callgraph1.jpg

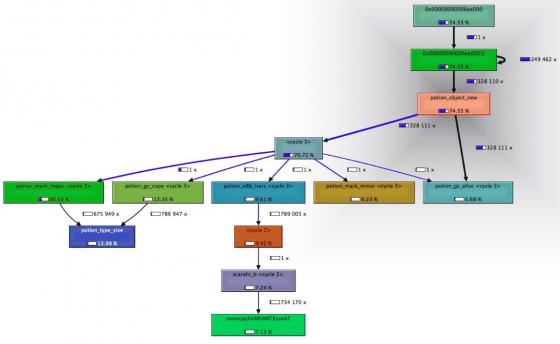
You see better that for all the object_new allocations the GC needs 30% time in a major phase and 10% time in a minor (shorter) phase.

Install kcachegrind on MacOSX with ports

Well, you don't want to install kcachegrind with port.

$ sudo port search cachegrind
kcachegrind @0.4.6 (devel)
    KCachegrind - Profiling Visualization

Because building KDE takes hours, and you wont need it other than for cachegrind. But there's a QT variant coming with kcachegrind, called qcachegrind. Maybe ports wants to use this variant. Or not, because kdelibs3 is listed as dependency.

$ sudo port info kcachegrind

kcachegrind @0.4.6, Revision 1 (devel) Variants: universal

Description: KCachegrind visualizes traces generated by profiling, including a tree map and a call graph visualization of the calls happening. It's designed to be fast for very large programs like KDE applications. Homepage: http://kcachegrind.sourceforge.net/

Library Dependencies: kdelibs3
Platforms: darwin
License: unknown
Maintainers: nomaintainer@macports.org

sudo port install kcachegrind
--->  Computing dependencies for kcachegrind
Error: Unable to execute port: Can't install qt3 because conflicting ports are installed: qt4-mac

So there's an artificial conflict, qt4-mac is better than qt3, and you can easily build qcachegrind with qt4-mac.

port deps:

sudo port install qt4-mac graphviz

This needed only one minute

Go to http://kcachegrind.sourceforge.net/html/Download.html Download the source tarball

kcachegrind-0.7.4.tar.gz 

tar xfz ~/Downloads/kcachegrind-0.7.4.tar.gz
cd kcachegrind-0.7.4/
cd qcachegrind/
less README
qmake -spec 'macx-g++'
make
mv qcachegrind.app /Applications/
open /Applications/qcachegrind.app

And it works.

Just gprof and gcc profiling via -pg does not work. But this is another story. So far I use XCode Instruments with the Time Profiler. See the next post Using kcachegrind on potion

On linux I did the same, just qmake without arg and

sudo cp qcachegrind /usr/local/bin/

Idea - costmodel for B::Stats

Co-workers often ask me, what is faster. This or this?

Of course you can benchmark the real speed, but theoretically you can look at the optrees and predict what will be faster.

parser updates

I worked on a new perl11 vm, p2, in the last months. In some perl11 meetings we identified several problems with the current architecture, and came to similar results as the parrot discussions a decade before.

Not only is the VM (the bytecode interpreter) horribly designed as previously observed by Gregg & Ertl 2003, also the parser is an untangable and not maintainable beast. And since any future VM should be able to parse and run perl5 and perl6 together, that's why we reserved use v6; and use v5;

Any new perl vm such as parrot, nqp with the jvm or other backends, niecza or p2 need to be able to parse both. perl6 cannot afford to leave perl5 aside, even if it's a much nicer language. That's why parrot came up first with the PGE based parser framework, which made it super easy for other language to target parrot in the first years.

Parrot's PGE library is based on peg - Parsing Expression Grammar, a new parser language, different from the old yacc or hand-written recursive descent parsers. The only peg C library is peg/leg by Ian Piumarta, which is also used by p2, based on some extensions by why the lucky stiff, renamed to "greg" and subsequently used for other little languages also. _why advanced it from 0.1.9 to 0.2.2 with potion, I advanced it to 0.2.3 for p2, Amos Wenger advanced it to 0.4.3 for his ooc language by adding error blocks and fixing some bugs, and today I advanced it to 0.4.5.

This is only greg, the parser generator, not the p5 or p6 syntax itself.

Larry's perl6/std with the viv metacompiler contains the canonical Perl6 grammar and now also a Perl5 grammar. Written in perl6, interpreted and compiled in perl5 (via viv).

Flavio Glock wrote hand-written p5 and p6 parsers for perlito, and those parsers really show off, as they look much nicer, readable and maintainable as table-driven parsers such as ours, if based on yacc (perl5) or peg (std, p6, p2).

Using a PGE library means that you can interpret the parser statemachine at run-time, which easily allows parser extensions, so called macros. Using a standalone parser generator, such as yacc, marpa, greg/peg/leg just generates C code for the parser statemachine, but extending such a statemachine dynamically is a not yet solved problem. Ian Piumarta and his idst crew work on the basis of such interpreted but efficient parsers, e.g. by jitting the statemachine as done in maru. That is something like a jitted regex engine, just a bit more advanced, as a regex is just a small subset of a general parser.

Advancing on that I believe that the new regex engine should be builtin into the VM, such as the LPeg library for lua is a general PEG-based matcher, which can be used to implement the simplier pcre library. I can really feel the pain of normal programmers which need to use the old-style perl,grep,sed regular expressions, while they could use a richer language as in LPeg or lisp matchers.

I am the opinion that an extendable parser needs to be based on LR based, such as yacc, and not on PEG and its ordered rules. Only with LR you can easily add rules alternatives without destroying the fragile order of evaluation in a PEG. With a PEG you'd need to add the position of the new macro rule manually.

So using greg is effectively a dead end, and I'd need to start extending yacc somewhen, adding a yacc library and yacc run-time. Which means something like hooking the created statemachine into my vm, or by jitting the states. The java based parser generators, like antlr have a huge advantage there.

About Reini Urban

user-pic Working at cPanel on cperl, B::C (the perl-compiler), parrot, B::Generate, cygwin perl and more guts, keeping the system alive.