Using kcachegrind on potion
cachegrind gives you information on the callstack and callcount, dependencies and efficiency. You can easily see hotspots in your code.
I use it to check the JIT and objmodel efficiency of potion, which is the vm for p2.
See my first post today Install kcachegrind on MACOSX with ports if you are on a Mac.
cachegrind
The first run with:
$ make bin/potion-s
$ valgrind --tool=callgrind -v --dump-every-bb=10000000 bin/potion-s example/binarytrees.pn
Ctrl-C
generates this sample
$ open qcachegrind
Open one of the generated callgrind.out.pid.num files.
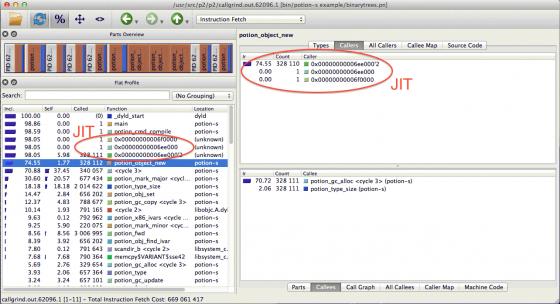
This code creates a lot of objects (potion_object_new), potion_object_new is called by the JIT (not instrumented because we did not use --dump-instr=yes (Click on machine code on the right lower pane), and potion_object_new spends most of its time allocating memory in the GC (potion_gc_alloc). 20-30% of the code is spent in the GC (potion_gc_mark_major and the other gc calls).
Instruments
Compare that to the Apple XCode tool Instruments:
$ open /Applications/Xcode.app/Contents/Applications/Instruments.app
- Select the Instrument "Time Profile"
- Select the target "bin/potion-s"
- Adjust the target settings with "Edit Active Target"
I used args "-B example/binarytrees-list.pn" for the bytecode vm, not the default jit. and I need to set the working directory, because the example is under the root.
This is a different sample, without JIT, and with using arrays (tuples) instead of objects. This way you can see any possible object overhead. And we see that most of the time tuple_push (add an array value) is not spent doing alloc, but realloc, an area where the GC should shine. But realloc apparently causes a lot of GCs. Of 39% realloc 30% is causing a full mark & sweep phase (mark_major), not a small mark_minor phase. But we are dealing with fresh objects here, not hot objects.
cachegrind graphviz
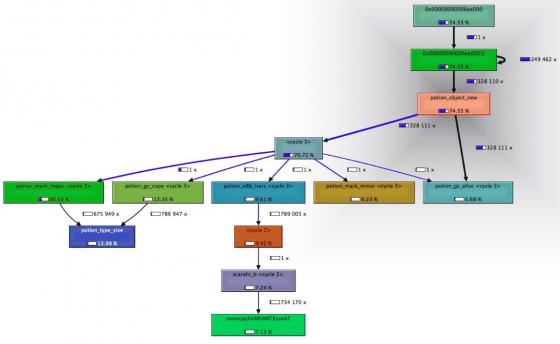
With the graphviz extension you can see the call graph easier. See the "Call Graph" tab on the lower right pane, which creates this graph.
You see better that for all the object_new allocations the GC needs 30% time in a major phase and 10% time in a minor (shorter) phase.


 Working at cPanel on cperl, B::C (the perl-compiler), parrot, B::Generate, cygwin perl and more guts, keeping the system alive.
Based on these samples I made the following changes:
1. overallocate tuples by 3. Start empty tuples with size 3.
This esp. helps the parser, which is not GC safe.
2. fix a bad runtime call to sig_at in the bytecode vm, which extracts the name of the signature and returns tuples of 3. Since we only need the name do not allocate tuples at run-time, use a new faster function sig_name_at.
These 2 changes made the bytecode ~4 times faster.
The call timings are now pretty averaged, no more spikes and peaks.
Another note: With Instruments you can watch the profiling data while running,
and it helps if you click in the left pane on "Invert Call Tree".