Data analysis and visualization in Perl
Hello everybody, this is my first post here, so forgive me if I screw it up.
Let me firstly introduce background of my work. Several years ago I landed onto a Perl job. It also involves some other languages like Python and R, but it was mainly Perl, until last year focus of my role switched and I still do some Perl but much less since then. I was a little bit sad. Perl is indeed a good language, but usually underated outside its community. I am quite good at several programming languages, but with Perl I feel most comfortable and productive. So I thought I might write something at my after-work time, to use my Perl knowledge to create something to give back to the Perl community.
I remembered I read this post Putting Perl Back on Top in the Fields of Scientific and Financial Computing a couple of years ago. I know Perl has PDL since long time ago, but why does it not have a big market share? Well, IMHO there are a few reasons, and one of them is that, it needs a whole ecosystem, by ecosystem I mean several strong libraries that target different aspects of scientific or financial computing, to fullfill user's needs. Python has numpy/scipy and matplotlib since early 2000s. And based on numpy they created pandas which is used a lot today in dataframe-based data analysis. R itself has out-of-the-box dataframe and plotting features, and Hadley Wickham's ggplot2 is so powerful that I heard people not switching from R to Python only because of ggplot2. For Perl IMHO it lacks a great plotting library, and it lack a library that can do dataframe well.
Then I decided to do something in this area: to improve ZMUGHAL's Data::Frame, and to port R's ggplot2 to Perl. It took me several months but it finally has got to a rough usable state. In recent couple of weeks I released two new libraries onto CPAN: Chart::GGPlot and Alt::Data::Frame::ButMore. The latter one was because I've not been able to reach ZMUGHAL.
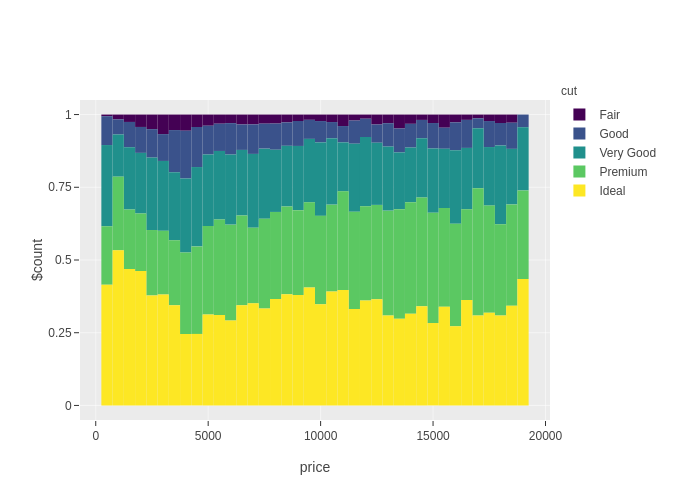
For those who have not heard of R's ggplot2, it's an implementaion of Leland Wilkinson's The Grammar of Graphics. Basically it allows one to define a plot by specifying various components like geometry layers, scales, etc., on a high level, and map columnar data to the plot. For example, below piece of code would get you that plot on top of this post.
#!/usr/bin/env perl

use strict;
use warnings;

use Chart::GGPlot qw(:all);
use Data::Frame::Examples qw(diamonds);

my $p = ggplot(
    data => diamonds(),
    mapping => aes( x => 'price', fill => 'cut' )
)->geom_histogram( binwidth => 500, position => 'fill' );

$p->show();
More of my Chart::GGPlot examples are here.
So that's it. Thanks for reading. And comments or ideas are welcome :-)
 I blog about Perl.
Commendable job.
Oh, cute chart!
I ask one question.
How to output as ping?
I guess you actually meant png? You can do it like $p->save("foo.png"). It requires you installplotly-orca, to be precise, its "orca" command findable via PATH env var. If you don't have it, ideally the error message would tell you to get this "orca". Let me know if I am wrong, and I will fix it. See also https://github.com/plotly/orca and https://github.com/plotly/orca/releases
My library is structured in such a way that it would be possible to support multiple graph backends. Now the only and default one uses Chart::Plotly, and plotly requires that "orca" to be able to export to static images. In future I will create an Alien::Plotly::Orca module to make it convenient.
Thank you for your comment.
I install Chart::GGPlot into my CentOS server.
And I run example program in this entry.
I write frank comments to improve user experience.
1. Hope installation more fast.
When I install Chart::GGPlot, 155 distribution is installed.
I feel installation time is too long.
2. Hope Chart creating more fast.
I run this example. I wait over 30 hours.
In R language, Chart creating time is much fast.
3. Chart::GGPlot depend on JavaScript library.
When I read blog entry at first, I think Chart::GGPlot is pure Perl/XS library.
And I thought chart is output to png image easily.
Chart::GGPlot is depend on JavaScript library now.
Goal and Design of Chart::GGPlot is very attractive!
Thanks for your comments.
1. Yes I also feel there are too many dependencies. I will try to reduce some of them. On the other hand, compared to Python and R, Perl's CPAN distributions are generally of smaller granularity.
2. "I wait over 30 hours." Oh no are you sure it's really 30 "hours"? On my Ubuntu Linux virual machine it takes from 5 seconds to 30 seconds for each of my examples to export to png. Showing in browser is faster. To be frank, that time to export to png is slow compared to R. But that's the overhead in plotly-orca. plotly-orca has a single run mode and service mode. Now it's single run mode. In future I probably can work with Pablo, author of Chart::Plotly, to support the service mode.
3. R ggplot2's graphics layers are like this, ggplot2's geom implementations uses "gtable", and "gtable" uses "grid", and "grid" is based on R's base graphics C-api. I think there be altogether ~30k lines of code in those several R libraries. Python's port of ggplot (v1) used matplotlib as its graphics backend. For Perl there is not such a high-level graphics library of similar level of sophistication. We probably could build the layers all the way up upon Cairo, but that's too huge work for a single person. Actually before I really started Chart::GGPlot work I made an experimental and incomplete port of R's "grid", as "Graphics::Grid" published on CPAN. And then I felt I would give up that path, and instead just make use of plotly.
Sorry 30 seconds.
Is it difficult to write point, line, color, text from data frame by Cairo?
Cairo itself relatively low level. In R's implementaion there are multiple layers between the high level of ggplot2 and R's base graphics api, the latter is similar to Cairo. There are quite a lot implementation details there. For someone familiar with both Perl and R (like me), and based on my existing work of Graphics::Grid, it could still take 6~12 months to port all that from R to Perl in spare time.
I think one of Perl lacks is Perl/XS graphic library which can create 2D/3D chart easily.
If installation become easy and perfomrance of chart creating is improved as same as R language, it become more attractive for me.
IMO both a Perl/XS graphics backend and the plotlyjs backend have their merits: a Perl/XS backend would be performant in terms of exporting static images, while the plotlyjs backend best suites a web-based environment like Jupyter Notebook. At this stage I have no plan to write a Perl/XS graphics backend. I would rather invest in getting my stuffs, this data frame and ggplot libraries, to better work with Devel::IPerl in Jupyter Notebook.
btw, I released new Alt::Date::Frame::ButMore and Chart::GGPlot the other day. There're some performance improvements.