Keeping an eye on request duration
Some of you already know that I like optimizing things (modules, applications), regarding speed and scalability. For optimizing, you typically benchmark and profile. Regarding web applications, what I find very helpful also is observing request duration over time.
I've been doing this for quite a while now, and I found out, that this is not very common, so I would like to give an example and explain why it can be helpful. I'm also interested in other examples and typical values. (The only post about something like this I found was https://blogs.perl.org/users/mo/2011/07/exciting-updates-to-metacpan.html)
I'm using munin for displaying the data.
The web application
My forum software has been running live for 4 years now. Regarding its features it's quite similar to perlmonks.
With every page, you also see some items displayed:
- Currently online users
- Number of new (unread) messages in inbox
- Chatterbox
- A random message changing every minute
- A widget similar to the personal nodelet
- On the forum start page and latest threads, a link to currently unapproved posts (if you are a moderator)
So there is a lot of data to fetch with every request, apart from the actual page content.
I'm doing a lot of caching with memcached. Some of the data is only cached 1 minute; for example the list of online users.
As a consequence, the request duration can vary a lot, depending on the traffic. If there is high traffic, most of the requests get their data from memcached, so the requests are faster; with less traffic the requests have to fetch more from the database, so they are slower (which is ok though, when you don't have much traffic).
I'm saying this because this can influence the statistics about the request duration. Keep that in mind and observe the number of requests also. (By watching at the apache requests plugin or by writing a plugin which only counts the script requests; the latter might be more useful).
Another disadvantage is, that the displayed average request duration is not the real average. Munin fetches data every 5 minutes and displays them in the daily graph. For the weekly graph, you get the average of the 5-minute-average, and so on. So if there is a timeframe with very few requests, for example 3 requests which take 100ms each, and another timeframe with 100 requests and 40ms each, the cumulated average will be 70ms. That can lead to some unusual peaks, but in general it's useful.
Now, if you do an optimization, you can observe (ideally) that the line in the graph goes down, and how much. I find this highly motivating and helpful to estimate other optimizations I'm planning to do in the future. It can also help convincing your boss/team manager of doing an optimization.
Especially using memcached (and/or something like Lucene/ElasticSearch) can make your application much more scalable, or alternatively save a number of machines.
Example
So here's my example of the forum requests (values are milliseconds):
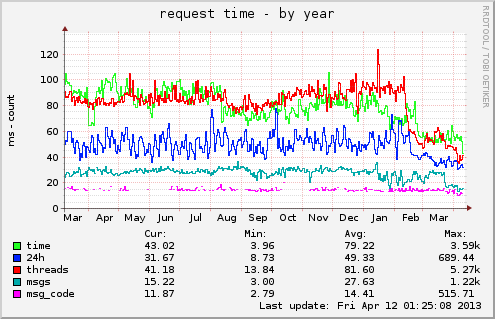
For me the most important thing is the request duration of forum threads (the red line). You can see how it decreased during the last months, because I made several optimizations. (The other increases and decreases are mostly results of different traffic amounts).
(The site has about 0.14 script requests/second.)
For setting up such a munin plugin, you need to get the data and print the output to munin. If you activate microsecond logging in Apache by using %D in your LogFormat, you can parse the last 5 minutes of the accesslog, for example with the unix tool "tac". (I'm doing my own logging and measure the time inside of the modperl handler, which should be comparable to what apache logs in %D)
If you want to display two lines, for example thread requests and the rest of the script requests, then it would look like the following:
#!/usr/bin/perl
use strict;
use warnings;
use v5.10;
if ($ARGV[0] eq 'autoconf') {
    print "yes\n";
    exit;
}
if ($ARGV[0] eq 'config') {
    print <<'EOM';
graph_title request time
graph_order time threads
graph_args -l 0 --base 1000 --alt-autoscale-max
graph_category apache
graph_vlabel ms
time.label time
time.type GAUGE
time.info Average script request duration
threads.label threads
threads.type GAUGE
threads.info Average thread request duration
EOM
    exit;
}

# get the average of script requests from access.log
my ($thread_ms, $script_ms) = calculate_average_of_last_5m();

# If there were no requests, don't print out the regarding line, otherwise
# munin will assume 0 which will falsify the statistics.
if ($script_ms) {
    say "time.value $script_ms";
}
if ($thread_ms) {
    say "threads.value $thread_ms";
}
And that's it. Well, the code for parsing the accesslog is missing ;-)
This script will be called every 5 minutes.
First, you should of course install munin. On Debian, install munin, munin-node and possibly munin-plugins-extra.
Make your script executable and put it into /usr/share/munin/plugins/requestduration.
Create a link /etc/munin/plugins/requestduration to this script.
$ /etc/init.d/munin-node reload
In the next run it will appear in the Apache category.
Don't get frustrated when starting a new plugin, because it usually takes some time until you see a helpful graph and get a feeling for the numbers.
 just another perl punk,
Leave a comment