It's beginning to look a lot like k-Means 🎵
... every where you go! ☃ ☃ ☃
Continuing on from the intention of clustering data in Perl (a form of unsupervised learning), I'm going to start with PDL::Stats::Kmeans and see how far I can get.
Let's just plunge in and use the module and read the documentation after to figure out what it all k-means. (sorry)
If you read the last post you'll see how to import a bunch of cars into a piddle and we can get started. If for some reason you can't get the csv file then just create some random data in the REPL/shell with
pdl> $c = random(33,11)
which gives you the same shape of data with values in the range [0,1]. If you wanted something a little more like the cars csv, you could do this
pdl> $integer = ceil( $c * 100 )
pdl> p $integer
which looks nicer
[
 [65 15 37 51 ...
 [53 24 69 87 ...
 [ 3 74 31 71 ...
 [78 97 67 14 ...
 ...
]
but you'll find that one of the possible steps in the clustering process is normalizing the data to the range [0,1]
So, assuming that you've got the file mtcars_001.csv, we're going to just remove the single header line, pull in the columns with numeric data (1 .. 11), take any other text values to BAD and turn up the verbosity on the output of reading the file. Load in the Stats module that has the k-means code and, as promised, just do it.
pdl> use PDL::IO::CSV ':all'
pdl> $cars = rcsv2D('mtcars_001.csv', [1 .. 11], {text2bad => 1, header => 1, debug => 1});
pdl> use PDL::Stats;
pdl> %k = $cars->kmeans

CNTRD   => Null
FULL    => 0
NCLUS   => 3
NSEED   => 32
NTRY    => 5
V   => 1
overall ss: 623387.464844874
iter 0 R2 [0.79620262 0.76555083 0.78100136 0.78100136 0.75526545]
iter 1 R2 [0.83991216 0.76555083 0.83991216 0.83991216 0.75526545]
iter 2 R2 [ 0.8534725 0.76555083  0.8534725  0.8534725 0.75526545]
ok, what just happened?
The first bit of the output just gives you back the options that were set to their default values:
- NCLUS which is k, the number of clusters to find;
- NTRY - the number of random seeding trials
- V for verbose, prints simple status messages
and you can read the documentation for the rest. For the output you get:
- overall Sum of Squares (ss), a measure of the "goodness" of the classification
- the number of iterations with their R2 values
Examining the R2 values for different values of k can help us choose the number of clusters but I'll leave that for later.
So we now have 3 clusters. What do we know about them?
pdl> p %k

n [7 16 9] R2 0.853472495760015 ss
[
 [ 29.748571      375.4  76.622222]
 [ 5.7142857      13.75          0]
 [ 5473.0971  17923.369  27037.556]
 [ 6321.4286   14425.75  19490.889]
 [0.15857143     1.5681     1.3828]
 [0.47163571    5.73901  6.5863242]
 [ 9.1904857  48.295744  14.503622]
 [ 1.4285714          3          0]
 [         0     3.4375  1.5555556]
 [         0       3.75  6.2222222]
 [ 4.8571429    33.9375         24]
]
 cluster
[
 [0 0 0 1 0 1 0 0 0 0 0 1 1 1 0 0 0 0 0 0 0 1 1 0 0 0 0 0 0 0 0 0]
 [1 1 1 0 0 0 0 1 1 1 1 0 0 0 0 0 0 1 1 1 1 0 0 0 0 1 1 1 0 1 0 1]
 [0 0 0 0 1 0 1 0 0 0 0 0 0 0 1 1 1 0 0 0 0 0 0 1 1 0 0 0 1 0 1 0]
]
 centroid
[
 [ 17.014286       24.5  14.644444]
 [ 7.4285714      4.625          8]
 [ 276.05714  122.29375  388.22222]
 [ 150.71429     96.875  232.11111]
 [ 2.9942857     4.0025  3.3433333]
 [ 3.6014286      2.518  4.1615556]
 [ 18.118571  18.543125  16.404444]
 [0.28571429       0.75          0]
 [         0     0.6875 0.22222222]
 [         3      4.125  3.4444444]
 [ 2.1428571     2.4375          4]
]
The keys to this hash are n, R2, ss, cluster and centroid.
n number of members in each cluster and the R2 value was mentioned above. We have pdls of the membership for each cluster (3x31) and we get 3 centroids of each 11 dimensional cluster
How does R2 change with k?
Simple and straight forward
pdl> for ($i = 2; $i <= 10; $i++) {
pdl> %k = $cars->kmeans( { NCLUS => $i, V => 0 } );
pdl> print $i, "\t", $k{R2}, "\n";
pdl> }
and yet, doesn't have that clarity that you crave. I've never been truly satisfied with this method for choosing k, but haven't gotten around to finding a better one. Yes, other algorithms address this issue, but that doesn't help us now.
Here's a rough and ready plot of my R2 values
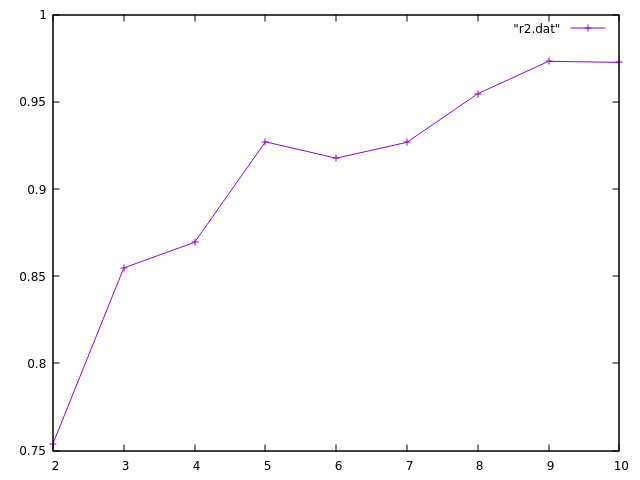
Maybe I should have normalized?
For next time
I'll have to finish this after the holiday, but what I'd like to get done is:
- showing cluster membership
- normalization
- displaying a 2D scatter plot of the clusters over 2 dimensions with their centroids
- getting some plain, old stats on each of the dimensions (min, max, variance, etc)
 I am a Freelance Scientist** and Perl is my Igor.
Fascinating...cant wait for your next post.
Thank you for helpful posts. I am keen to learn more about clustering with PDL.
Thank you for helpful posts. I am keen to learn more about clustering with PDL.