Preliminary results - Survey about Newcomer experience in Perl + One week reminder
Thank you!
Thank you to all who took part in the survey. Your contribution has been greatly appreciated and will help understand better the experience of newcomers in the Perl community.
You can still participate
If you have not filled in the survey yet, there is still time to participate. The survey will be live until October 22 and can be completed by any Perl contributor who joined the Perl community within the last two years.
The survey can be found HERE.
An older blog post provides some further details about the research project.
Some preliminary results
Here are some of the results drawn from the dataset collected during the first week of the survey.
Number of survey participants:
43 people took part in the survey so far (thank you again). 7 of the 43 people reported to have attended at least one Perl community event and 2 people went through some sort of mentoring while becoming contributors.
A wide array of roles was mentioned by the participants: ranging from users, testers, or developers to module authors,maintainers, or release managers.
44% of respondents had no FOSS experience when joining Perl whereas 37% reported to have 3 years or more of FOSS experience (the rest of the respondents falling somewhere in-between).
The participants reported to personally know between 5 and 6 individuals from which they can ask project-related information and reported to have 2 Perl members that they consider to be friends.
Involvement in Perl projects
On average, the participants reported to be currently involved in about 2 projects (ranging from 1 to 7 projects).
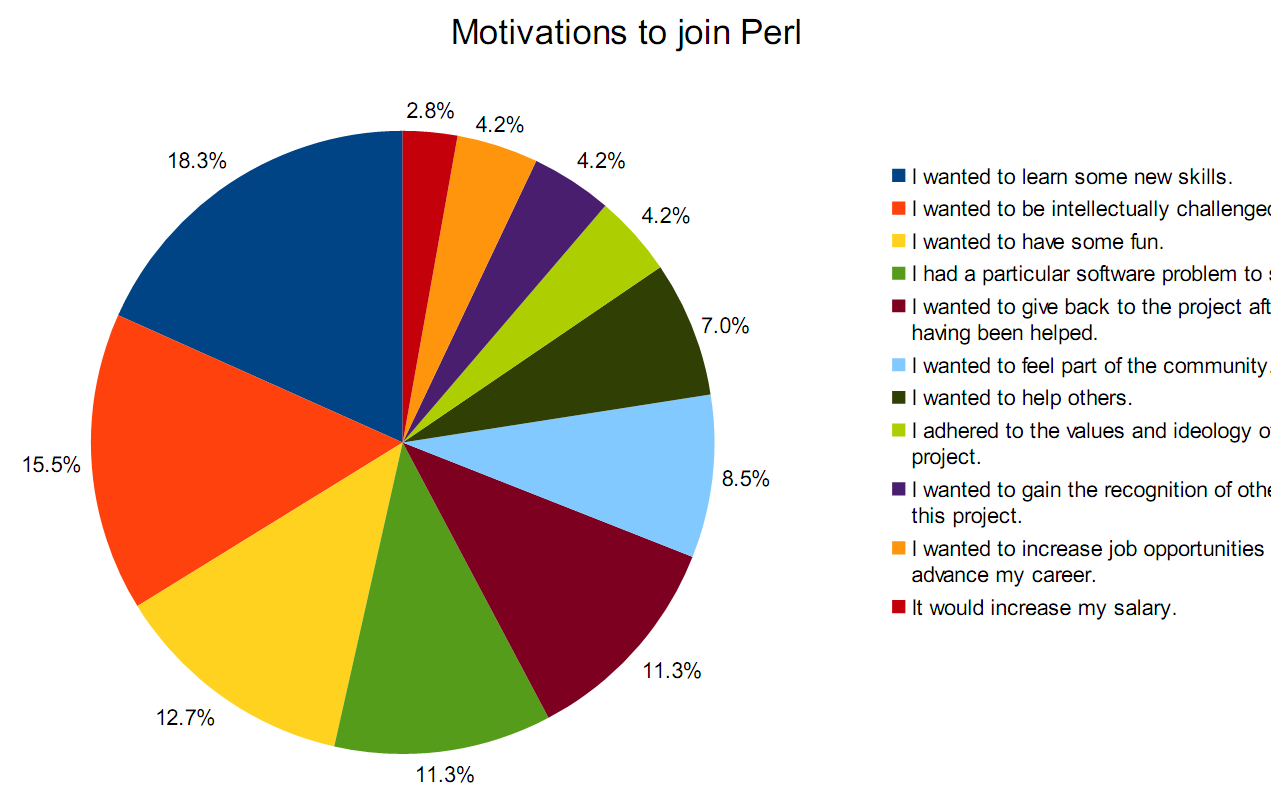
Reasons for joining Perl
Respondents were asked to report up to three reasons why they decided to join the Perl community. So far, the results showed some variation with 'learning new skills' and 'being intellectually challenged' being the first two motivations that came out.
Quick conclusion
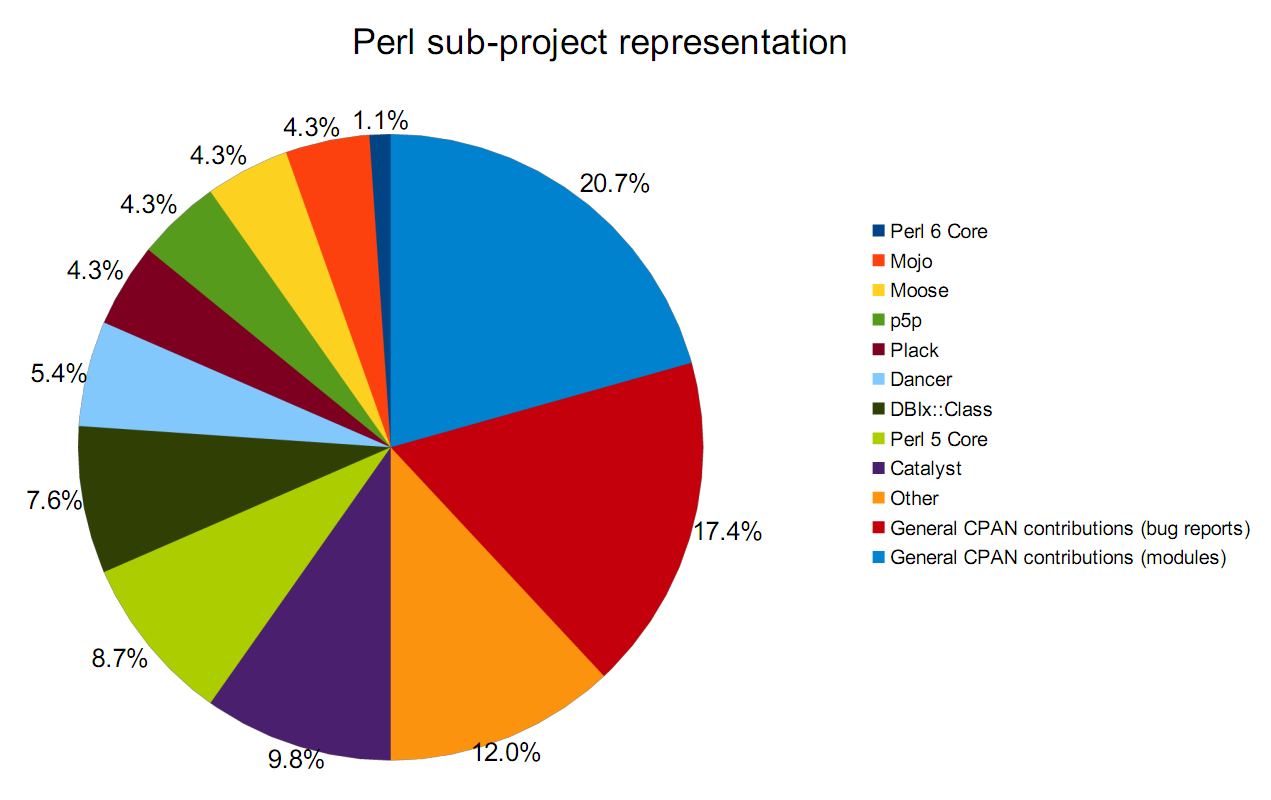
Some projects are still under-represented such as Perl 6, Mojo, or Moose. Newcomers working on those sub-projects are encouraged to take part in the survey as this would provide some interesting additional insights.
More detailed results will be presented in about a week or two, once the survey is finished.
 I am a PhD student doing some research about free/open source software communities. I am interested in newcomer experience and the concept of citizenship in FOSS.
Why not just use a bar chart to show the breakdown of the results?
Pie charts fail when there are more than a few items. http://www.stevefenton.co.uk/Content/Pie-Charts-Are-Bad/ A bar chart is much faster to scan and easily understand for this kind of data. Furthermore, even though you put the percentages next to each slice I still have to match it up to the key which has too small of text.
Charts in posts are good, bar charts in posts would be better.
Thank you for your suggestion.
I agree that pie charts have a several drawbacks. I simply wanted here to give a rough ideas about proportions.
This post is just some quick summary of the temporary results (after one week). When I compile the final results and write a post about them, I will make sure to use appropriate graphs and will also provide more relevant information.