
Stephan Loyd
- Website: github.com/stphnlyd
Recent Actions
-
Commented on Data Science and Perl
Just saw this today. I am the author of Chart::GGPlot and Alt::Data::Frame::ButMore, I know Perl/Python/R quite well, so I might have a say here. I actually had a similar question in my mind, given that Perl already has PDL which...
-
Posted Recent work on Chart::GGPlot to Stephan Loyd
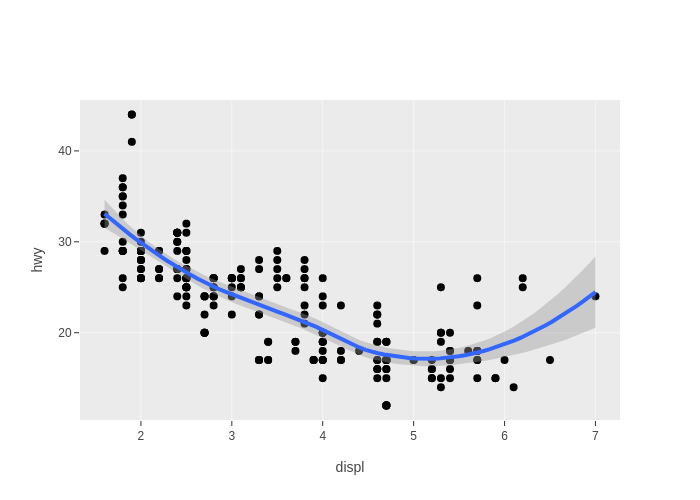
A couple of months ago I wrote this blog post ="https://blogs.perl.org/users/stephan_loyd/2019/03/data-analysis-and-visualization-in-perl.html…
-
Commented on Data analysis and visualization in Perl
IMO both a Perl/XS graphics backend and the plotlyjs backend have their merits: a Perl/XS backend would be performant in terms of exporting static images, while the plotlyjs backend best suites a web-based environment like Jupyter Notebook. At this stage...
-
Commented on Data analysis and visualization in Perl
Cairo itself relatively low level. In R's implementaion there are multiple layers between the high level of ggplot2 and R's base graphics api, the latter is similar to Cairo. There are quite a lot implementation details there. For someone familiar...
-
Commented on Data analysis and visualization in Perl
Thanks for your comments. 1. Yes I also feel there are too many dependencies. I will try to reduce some of them. On the other hand, compared to Python and R, Perl's CPAN distributions are generally of smaller granularity. 2....
-
Commented on Data analysis and visualization in Perl
I guess you actually meant png? You can do it like $p->save("foo.png"). It requires you installplotly-orca, to be precise, its "orca" command findable via PATH env var. If you don't have it, ideally the error message would tell you to...
-
Posted Data analysis and visualization in Perl to Stephan Loyd
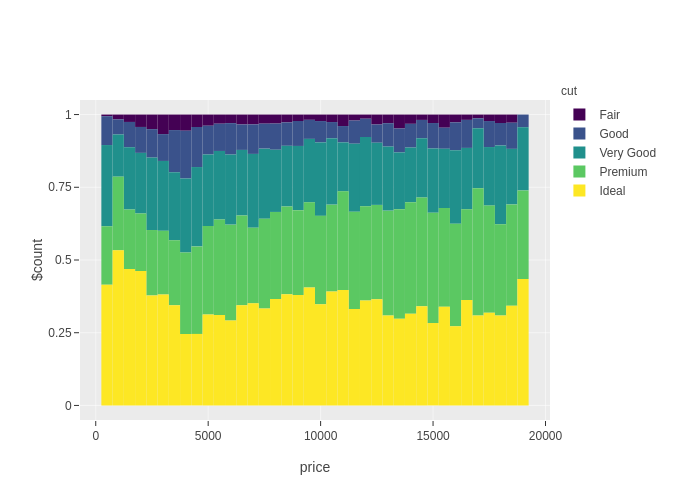
Hello everybody, this is my first post here, so forgive me if I screw it up.
Let me firstly introduce background of m…
 Recent Actions from Stephan Loyd
Comment Threads
-
Yuki Kimoto commented on
Data analysis and visualization in Perl
Goal and Design of Chart::GGPlot is very attractive!
-
Yuki Kimoto commented on
Data analysis and visualization in Perl
Sorry 30 seconds.
-
Yuki Kimoto commented on
Data analysis and visualization in Perl
Is it difficult to write point, line, color, text from data frame by Cairo?
-
Yuki Kimoto commented on
Data analysis and visualization in Perl
I think one of Perl lacks is Perl/XS graphic library which can create 2D/3D chart easily.
If installation become easy and perfomrance of chart creating is improved as same as R language, it become more attractive for me.
-
Carlos Kassab commented on
Data analysis and visualization in Perl
Are you still updating on this project?
I have started to work in a Perl module that implements EIF(Extended Isolation Forest) algorithm.
It would be great if your are still updating the graphical libraries
Kind regards
Responses to Comments from Stephan Loyd
About blogs.perl.org
blogs.perl.org is a common blogging platform for the Perl community. Written in Perl with a graphic design donated by Six Apart, Ltd.
