Recent work on Chart::GGPlot

A couple of months ago I wrote this blog post Data analysis and visualization in Perl. Then last month I released a 0.0003 version. And today I made a new 0.0005 release to CPAN. Some of the notable improvements in the recent releases are,
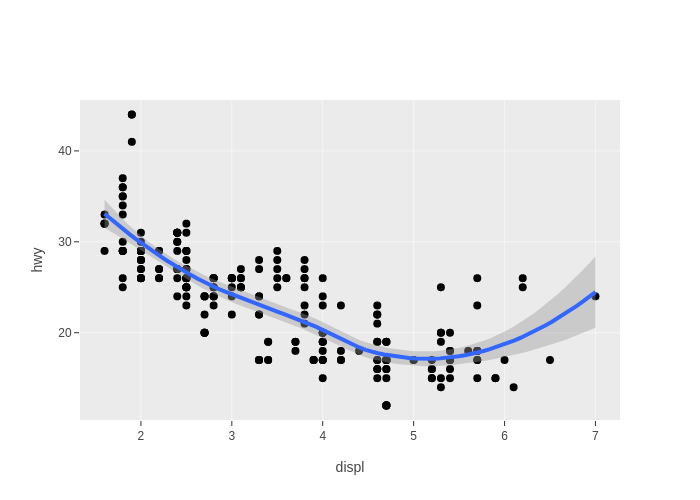
Experimental support for scatter plot smoothing (geom_smooth() function). Now it supports LOESS local regression and simple linear regression. To support I created a Math::LOESS package to wrap Cleveland's C/Fortran code. The linear regression is implemented via PDL::Stats::GLM and PDL::GSL::CDF, it's ideally possible to support gernalized linear models but I would put it off to a future time.
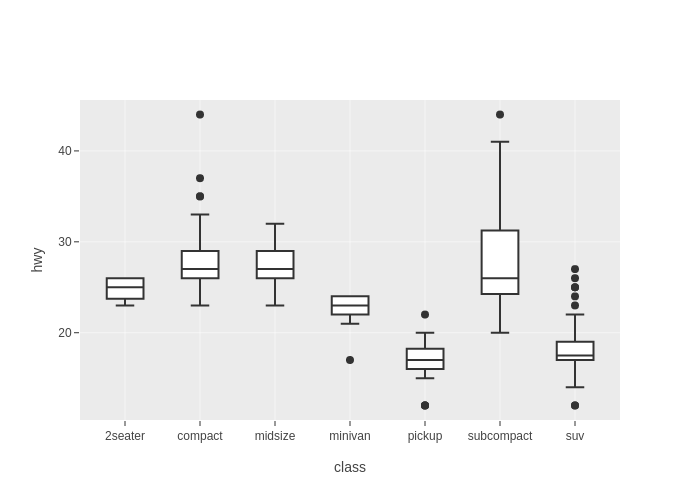
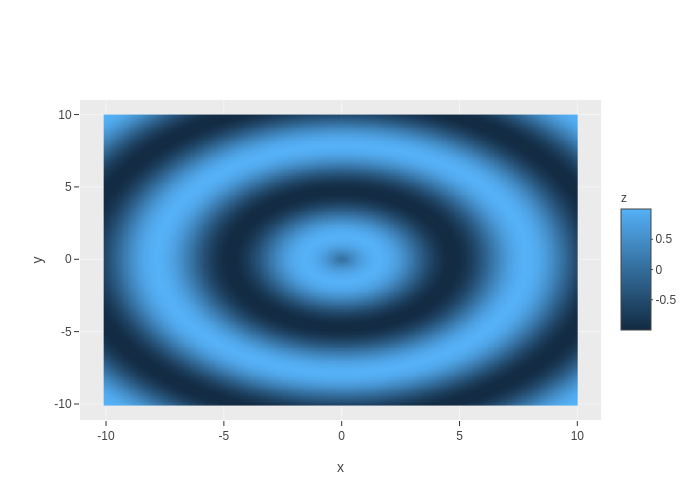
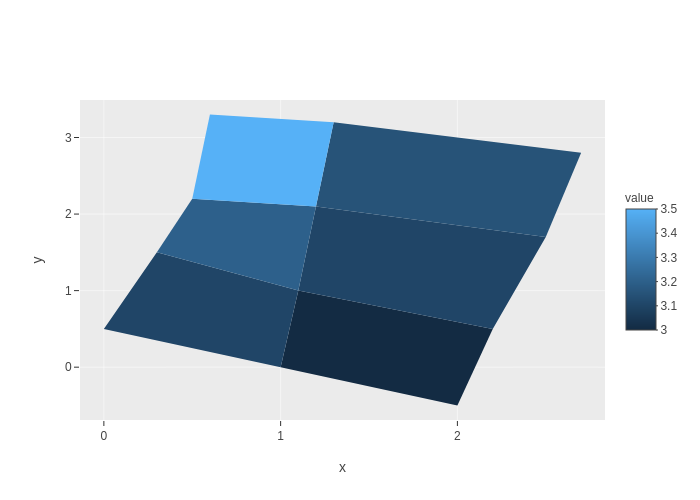
New geom types: boxplot, polygon, rect, tile, and raster. “boxplot” is for depicting data's distribution by visualize the quartiles. "raster" in the ggplot system is usually used to create heatmaps, which is commonly for representing data values in a matrix. "polygon" is used implement quite a few things including smooth confidence intervals, the rect and tile geoms, and it's ideally possible to be used to implement geographic spatial plot (, plotly.js seems to have its own plot type for spatial visualizations though). Examples of boxplot, raster, and polygon are shown at end of this post.
I created an Alien::Plotly::Orca package to facilitate the installation of plotly orca.
Performance of both libraries Chart::GGPlot and Alt::Data::Frame::ButMore have been improved. Your mileage may vary. On my Virtualbox Ubuntu guest for an extreme case of "diamonds" scatter example which has about 54,000 rows of data, it took > 45 sec for the first release of Chart::GGPlot to run and export to png, it now takes < 15 sec (including reading the data frame from csv format, processing the data, and plotting via plotly-orca, plotly-orca runs for like 6~7 seconds).


 I blog about Perl.
Thanks for incredible library Stephan! I hope it that little by little it will become more known.